Understanding F:M Ratio

F:M ratio as a theory is one of the most important aspects in wastewater treatment but also one of the most poorly understood concepts. Occasionally textbook numbers are good guides, however there are many instances in which understanding the complexity of F:M ratio may help to provide further insight. As a consultant it is very common to see strong emphasis on calculations such as F:M ratio. The emphasis on these calculations have the ability to impact potential operational changes we make, however F:M values as shown on paper do not always reflect actual conditions as to how the bacteria behave and may be viewed under the microscope.
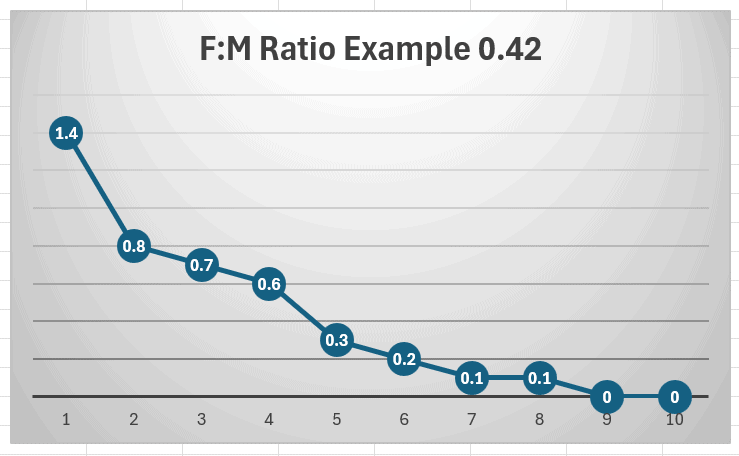
F:M Ratio as a Gradient
F:M ratio calculations take the proportion of food (i.e., lbs. of BOD) against the proportion of mass (or microorganism). An overall F:M ratio calculation assumes that the available amount of food is constant throughout the basin. The biggest flaw in this calculation is that all food (i.e., BOD) is not the same. To visualize a true F:M curve one must think of what the actual F:M ratio is at various points in the aeration basin (i.e. very high at the front end and little to no available food on the back end).
All “F” is not the Same
There are many different fractions of BOD including particulate, soluble, and BOD in the form of volatile organic acids. A good analogy for this extends to nutrition and the difference we experience eating “oatmeal” vs drinking “Kool-Aid”. Oatmeal is complex and there are many enzyme reactions that need to occur before it can be taken up in our mitochondria, whereas if you provide Kool-Aid to children at a birthday party, the impacts on their energy levels may often be seen within minutes (as chaos ensues!).
A good visualization technique for this concept is to picture the “mouths” of bacteria (their cell membranes) as a “filter”. Food that is small enough to pass through this filter immediately enters the cell (absorption), while larger “pieces” adhere to the outside of the cell membrane where biochemical reactions occur to process the food to where it can enter the cell. The “smaller the pieces” of food, the higher the actual F:M ratio is in the initial contact zone of the aeration basin.
Septicity/Fermentation Impact on Availability of Substrate
A simple way to look at fermentation reactions versus “complete” treatment of BOD is based upon the availability of an oxygen electron receptor (free or combined). When there is an oxygen source available this is used, Krebs cycle reactions occur, and end productions of new cell mass, carbon dioxide, and ATP (energy) are produced. When there is no oxygen electron receptor available, “full treatment” doesn’t occur, but rather larger “pieces of food” are converted to smaller pieces (think incomplete anaerobic treatment- formation of volatile acids). Substrate such as Acetic acid are immediately available in the aeration basin and generally either oxidized or stored by bacteria within 15-30 minutes of treatment. Therefore, the more septicity that occurs prior to the aeration basin, the more amount of readily available substrate, and the higher amount of readily available “F” there is to meet the RAS in the front of the aeration basin. Note that the BOD concentration itself may not have changed as fermentation occurs, but the food becomes more readily available once it is exposed to septicity.
The “Race” in the Initial Contact Zone
The initial 15-30 minutes of aeration have significant impact in which bacteria gain competitive advantage due to their various kinetic growth rates, storage capabilities, morphology, and other conditions. This small section of the aeration basin is only represented by a sliver in the overall F:M calculation, however it is vital for which bacteria ultimate gain competitive advantages.
Extended Aeration Processes and systems with large Aeration Basins
In systems with high hydraulic retention times, there is often a prolonged period on the “back end” of the aeration basin in which there is low food availability, or often endogenous activity (think “aerobic digestion”/cannibalism). In these systems, it is possible for conditions on the “back end” as well as the front end/ “initial contact zone” to have significant impact on the bacteria which are selected. Dr. Richard described these systems as “dual sludges”. In these systems the F:M ratio often appears low on paper, however it is possible for microbes that gain competitive advantage in the “initial contact zone” to also play a major role in biomass conditions.
BNR and Other Factors
Due to the complexity of many emerging treatment schematics F:M ratio is further impacted. Examples include reactions in anoxic and anaerobic selectors and well as carbon availability in areas such as post-anoxic zones. In systems such as selectors internal cellular storage may be promoted wherein soluble BOD may be taken up into the cells, however not yet oxidized. Many bacteria also can store substrate in aerobic zones (i.e. PHB granules) in which they can gain competitive advantages over other bacteria when there is a high actual F:M ratio (in terms of high amounts of readily available food).
The” M” Component
The actual amount of available food (“F”) is only part of the equation and many of its complexities are explained above. Factoring in “M” (microorganisms or mass) there are further considerations including inert fractions, fractions of MLSS concentration that are polysaccharide, fractions of MLSS concentration that are protozoan, metazoan etc., and the actual % of bacteria that are alive/viable/ Please note that MLVSS is a better representation of separating inert fractions and does not distinguish between viable and non-viable bacteria). A separate blog at Why the MLSS Concentration is Not Always Representative - Ryan Hennessy Wastewater Microbiology (rhwastewatermicrobiology.com) goes into further detail on understanding how MLSS and MLVSS.
Summary
Overall, process control calculations have their place but are best utilized when combined with accurate microscopy analysis. The bugs do not “lie” and the microscope always helps to tell the full story.
Technical Wastewater Information Resource: https://rhwastewatermicrobiology.com/wastewater-microbiology-book/